Introduction
What’s it like to live in a neighborhood that’s doubled in value? Why is the Huntington Palisades one of the most desirable of the dozen Palisades neighborhoods? What are some of the characteristics that distinguish it from other neighborhoods? How have home values changed there since the 2008-2011 market correction?
Historical background
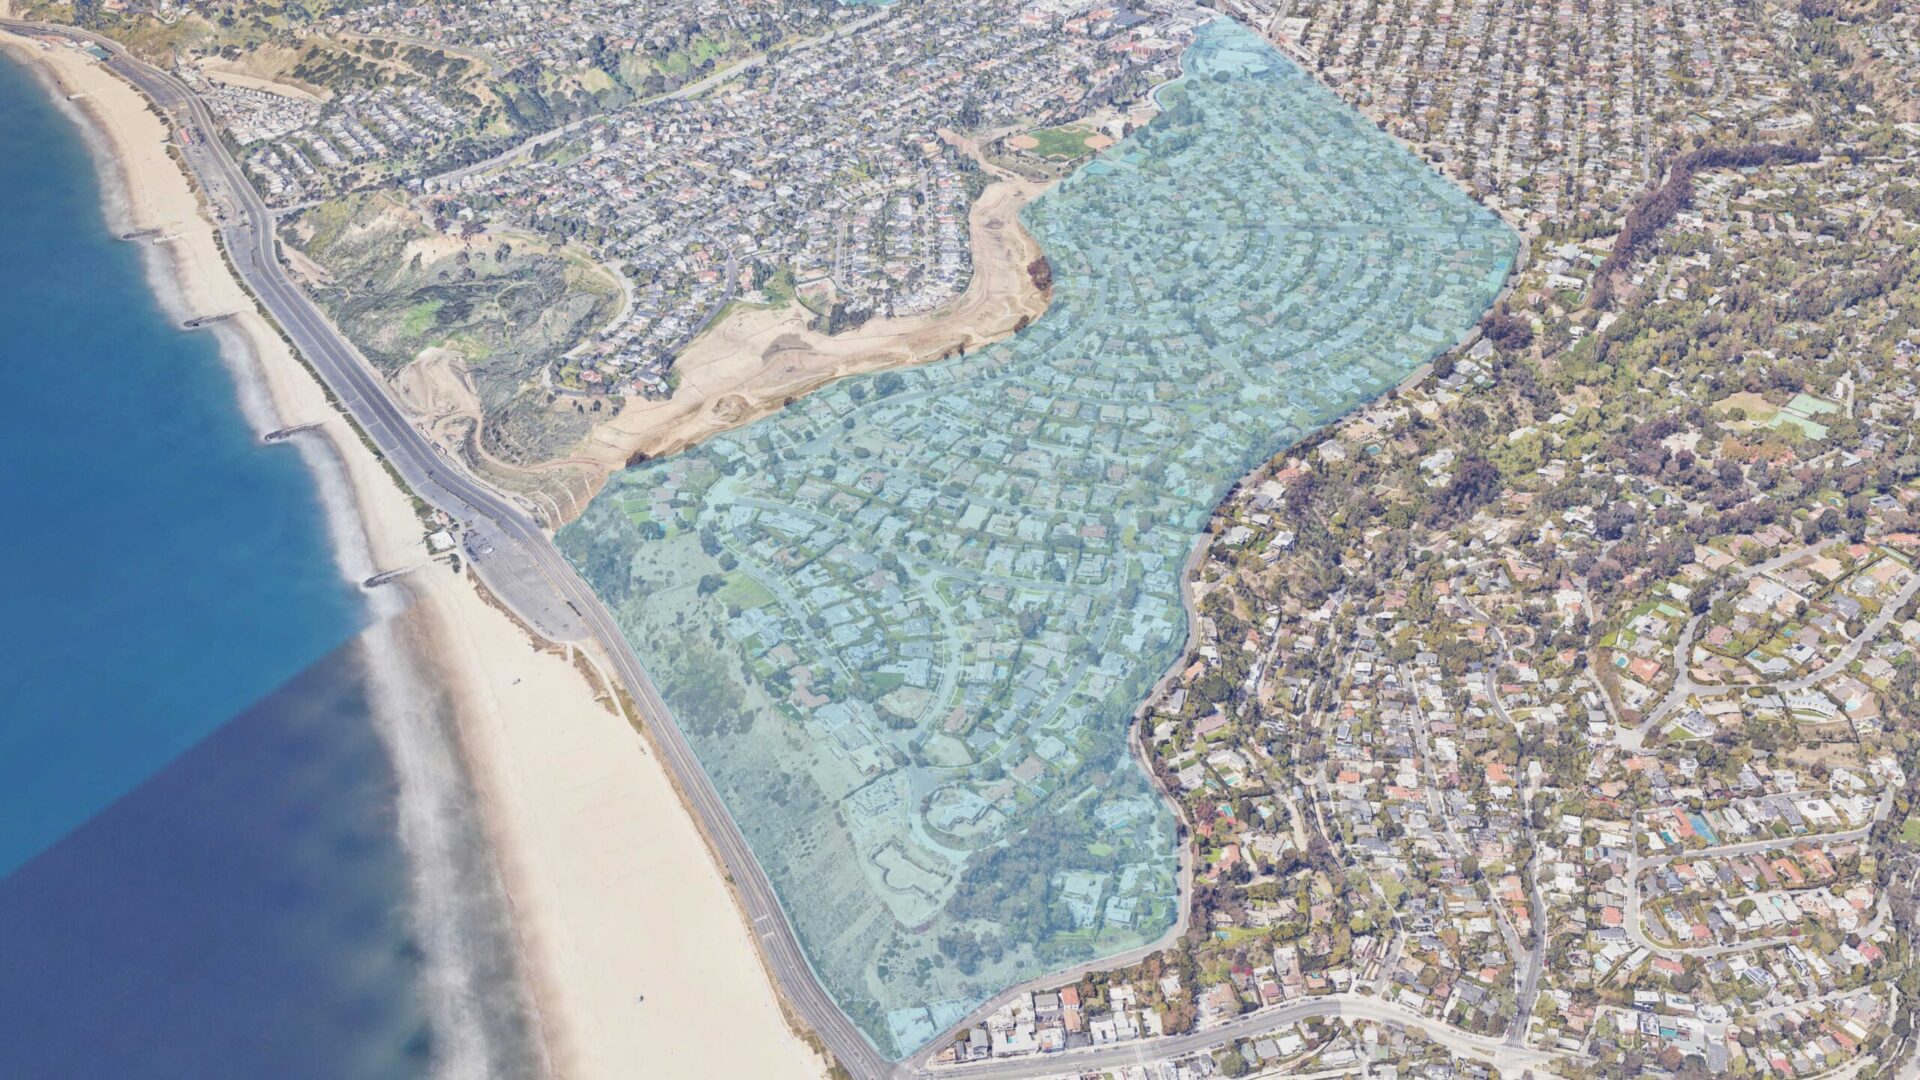
The area had its origin in 1926 when a 226-acre plot of land was bought for $1,625,000 by the Pacific Palisades Association from heirs of the Collis Huntington Estate. The concept was to create an “exclusive development for a discriminating clientele”. Broad streets were laid out in graceful curves to form concentric semi-circles around El Cerco Place and a large park off of Alma Real.
The area was one of the earlier developments that incorporated underground utilities and ornamental light fixtures were included. Because it was designed to maintain a high standard and appeal to upscale families, the 494 sites were varied in size to accommodate larger homes on the most desirable sites and along the view rims. The lots were sold at much higher prices than in almost any other area.
Characteristics of the Huntington Palisades
Most of the street names were derived from Spanish words, having been suggested by the engineer who developed the street plan. Some examples include Corona Del Mar, Frontera, Pampas Ricas, La Cruz, and Camarosa. Chapala was named after the largest lake in Mexico, and Ocampo referred to as a mining town or camp.
The proximity to the center of town has continued to be one of the most appealing aspects of the Huntington Palisades. Being able to walk to the village, park and library is valued highly. The current real estate market reflects this high desirability, with average prices of around $7 million as we near the end of 2021.
Changes in home values
The Huntington Palisades has seen a dramatic recovery in home values since the 2008-2011 market correction. Fueled by a steady increase in demand, prices have approximately doubled in the last 10 years. This chart illustrates the remarkable strength of the current market.
The Last Decade of Huntington Sales and Prices (as of September 2021)
| Sold | Median $ | Ave. $ | $/square foot | |
|---|---|---|---|---|
| 2021 | 33 | $6.6M | $7.2M | $1,557 |
| 2011 | 16 | $2.7M | $3.4M | $884 |
| % Diff | +100% | +146% | +110% | +76% |


