
Why 90272 Land is Selling Faster Than Homes: A Market Analysis
If you’ve been watching the Pacific Palisades market this year, you’ve probably noticed something that doesn’t quite add up at first glance: land is moving faster, while standing homes are not; some are even stuck in neutral. Dig into the numbers by price tier, and the story gets even more interesting because “the market” in 90272 right now isn’t one market at all. It’s several, stacked on top of each other, each behaving completely differently.
Right now, land is sitting at roughly 4.4 months of supply; a seller’s market by any traditional read (under 6 months typically favors sellers; under 4 is tight). Standing homes, meanwhile, are at 6.1 months; essentially the classic tipping point between buyer’s and seller’s markets, tilting mildly soft.
That’s a meaningful gap for such different absorption rates for two product types in the same ZIP code, and it’s almost entirely explained by what’s happening underneath the surface: price segmentation.
Land: A Market Bunched at the Bottom, Frozen at the Top
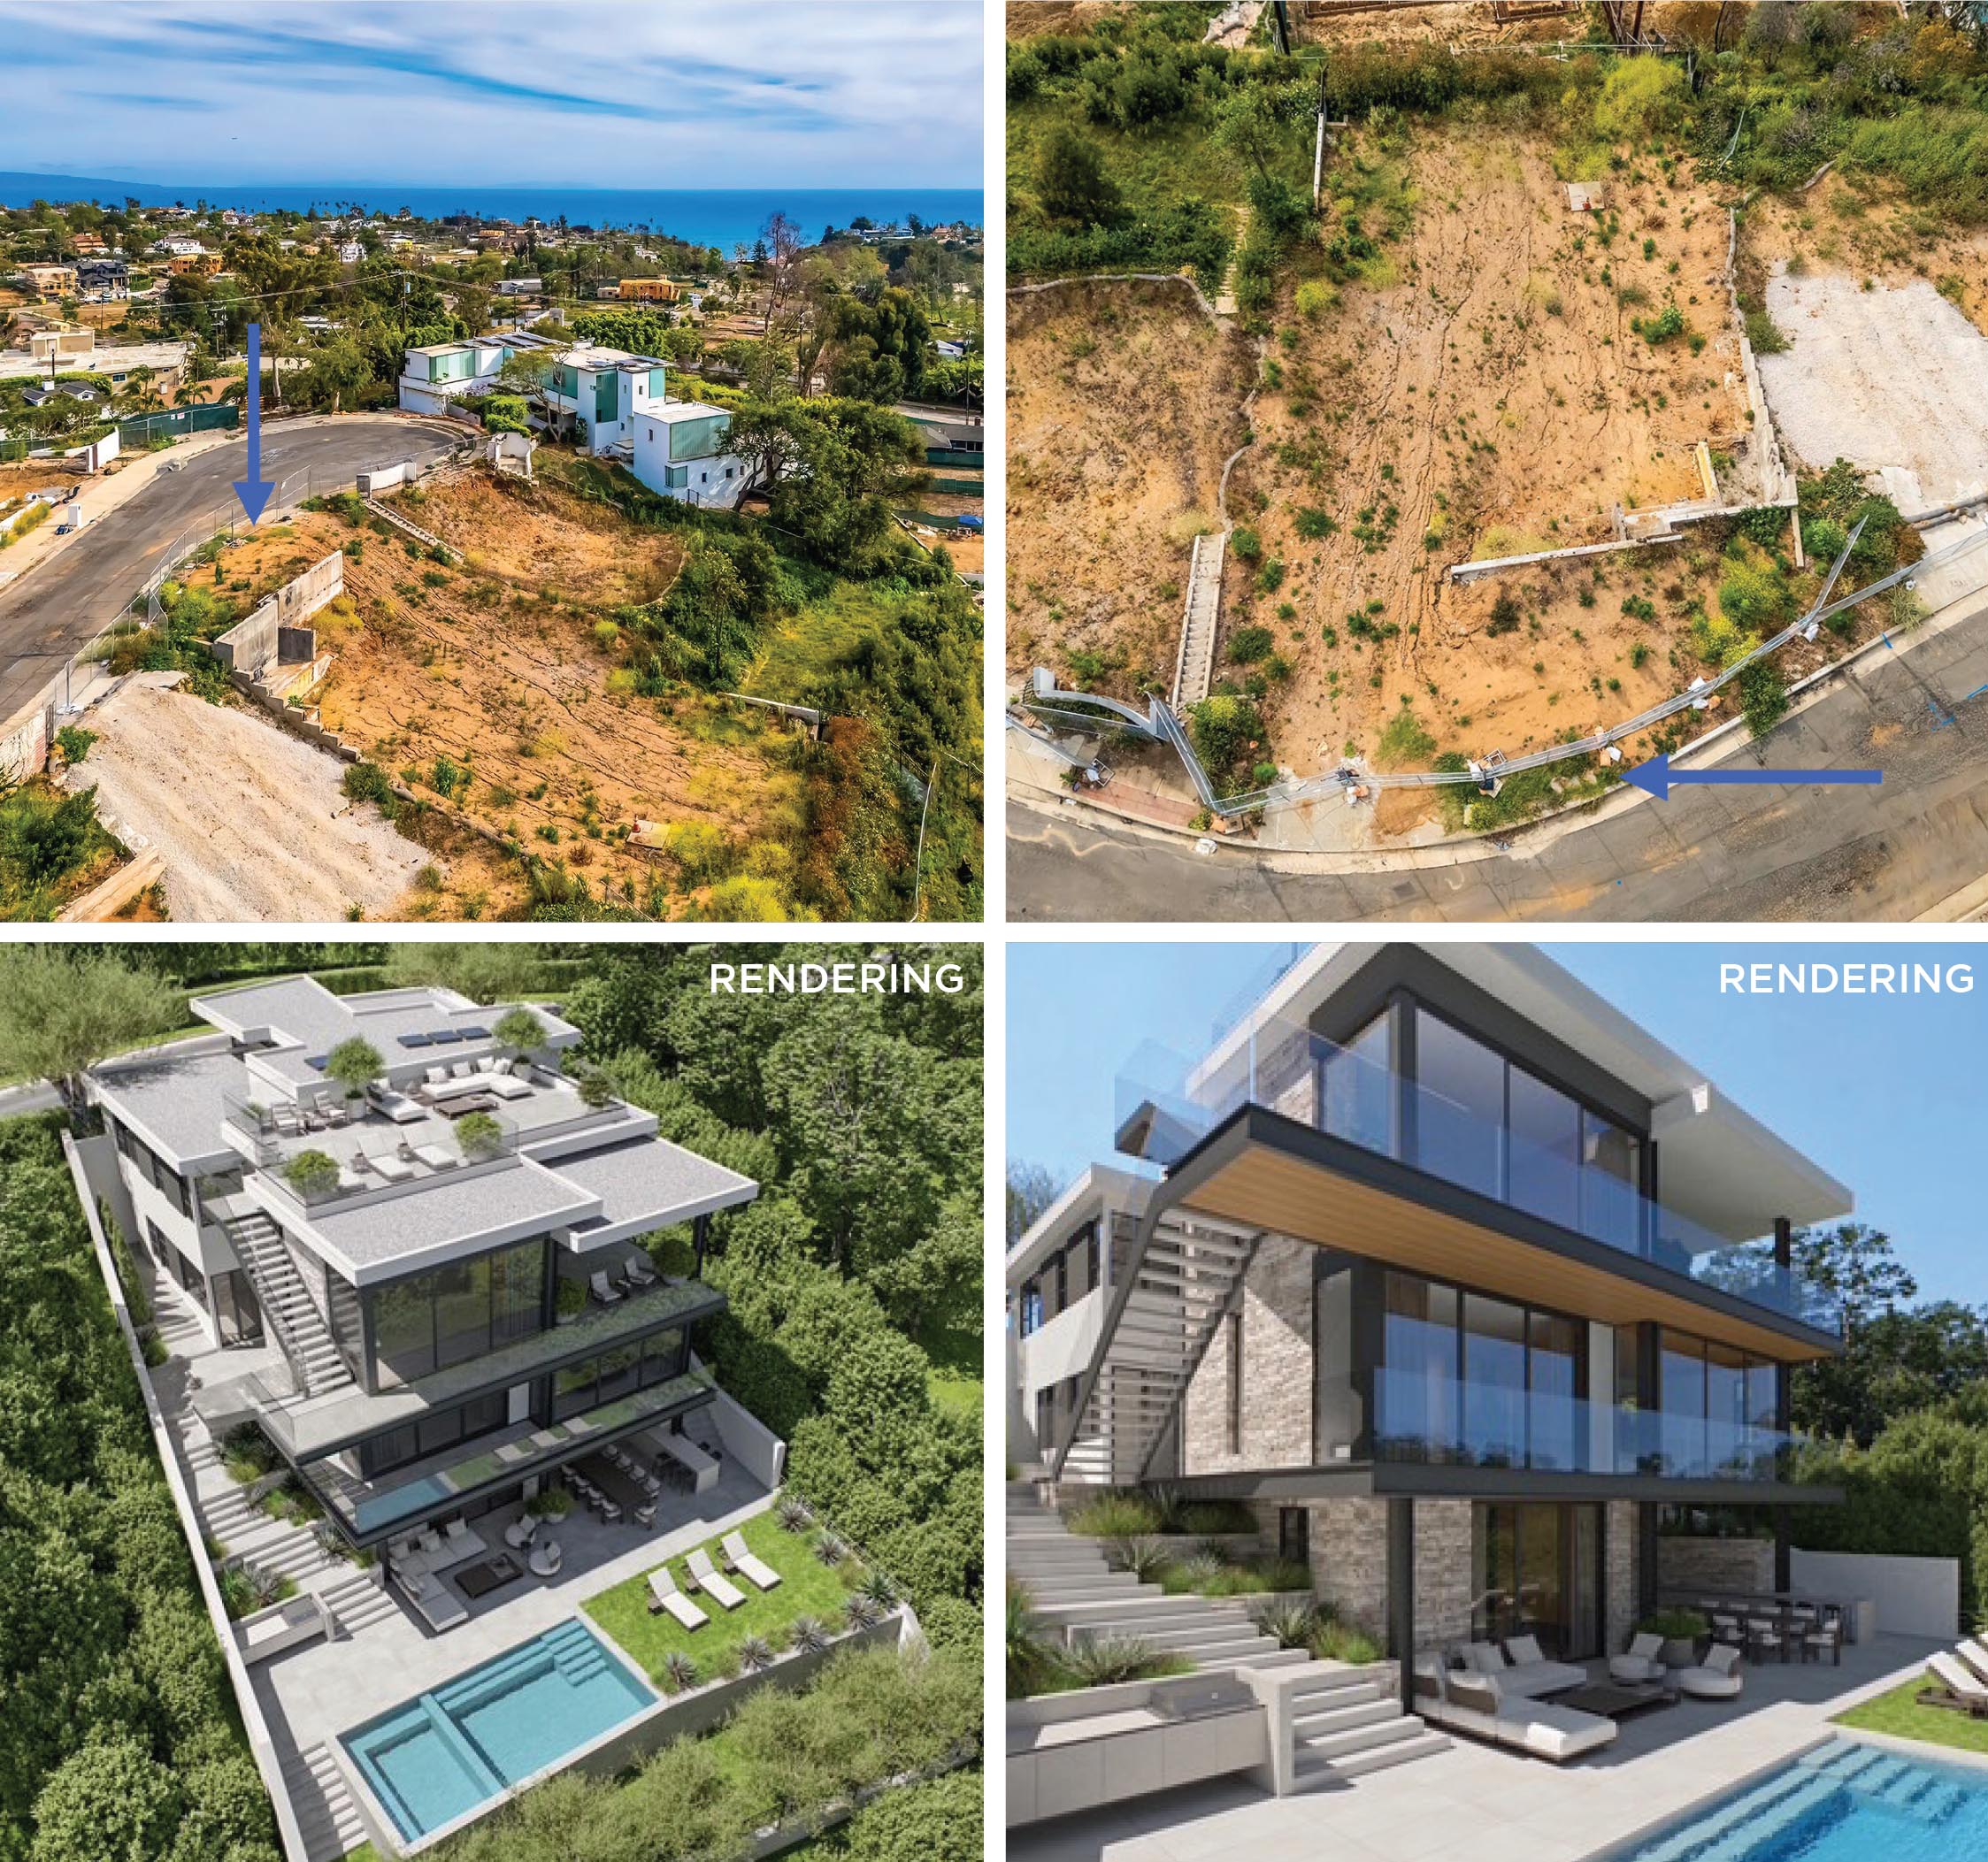
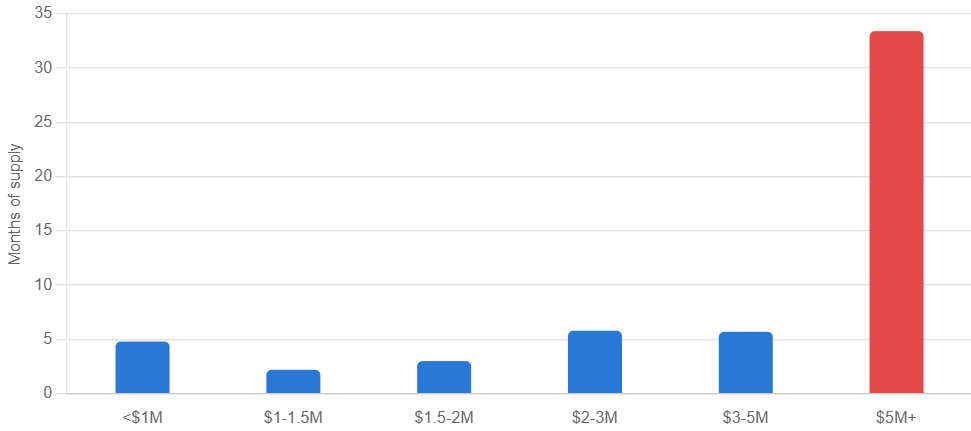
Land sales this year cluster hard in the $1–3M range: roughly 82% of everything that’s closed. Within that band, the $1.5–2M tier is the standout: just 3.0 months of supply and a 44-day median days-on-market, the fastest-moving corner of the entire land market. The $1–1.5M tier absorbs even faster on paper (2.2 months of supply) but takes longer to actually transact (71-day median DOM), a sign that volume, not speed, is driving that number.
Above $3M, the picture changes fast. The $3–5M tier is already balanced-to-soft (5.7 months, 112-day median DOM, which is the slowest of any land band). And above $5M, the market essentially stalls: 14 active lots against only 3 sales all year, a staggering 33+ months of theoretical supply. Buyers for $5M+ raw land in the Palisades right now are scarce, and sellers at that tier should expect a long runway.
Homes: Faster at the Middle, More Frozen at the Top
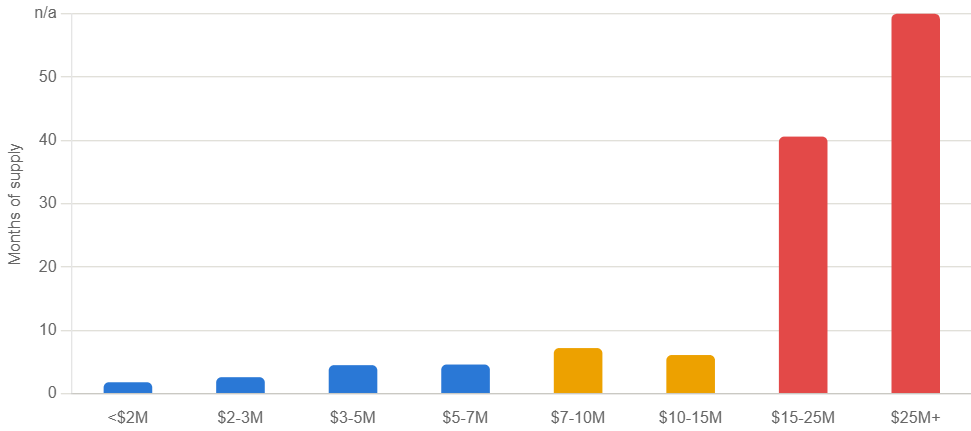
Standing homes tell a parallel but distinct story. The $2–5M range is the true hot zone: 2.6 to 4.5 months of supply and a remarkably tight 15-day median DOM, faster than any land tier posts. Buyers clearly want a turnkey product in this range, and they’re moving on it quickly.
But the ceiling effect is even more pronounced for homes than for land. The $7–10M tier already shows signs of strain (7.2 months of supply, 54-day DOM), and above $15M the market goes nearly dormant: 40+ months of supply in the $15–25M band, and zero sales all year above $25M despite five active listings sitting there.
Reading the Two Markets Together
Put side by side, a few patterns emerge:
Both markets are bifurcated by price, but land’s “sweet spot” sits meaningfully lower ($1.5–2M) than homes’ ($2–5M), which makes sense given the added cost basis of construction on top of raw land.
The ultra-luxury freeze is real in both categories, but it bites earlier and harder for land. Land demand thins out sharply past $5M; homes hold a reasonable pace out to roughly $10M before stalling.
Speed and absorption don’t always agree. In both datasets, the price band with the fastest month-over-month absorption isn’t always the one with the shortest individual days-on-market, a reminder that supply/demand balance and transaction velocity are related but distinct signals, and both are worth tracking separately.
Overall blended numbers can mask a lot. A single “4.4 months” or “6.1 months” headline flattens a market that ranges from 44-day sprints to 40-month freezes depending on price point. For sellers and buyers alike, the relevant number isn’t the ZIP code average but the number for their specific price tier.
The Takeaway
If you’re considering bringing land to market in the $1.5–2M range, you’re in a genuine seller’s market; price it right and expect real competition. If you’re sitting on $5M+ land or a $15M+ standing home, patience (and realistic pricing) will matter more than urgency; those tiers are simply not seeing enough transaction volume to support quick sales right now. And if you’re a buyer, the data suggests the best value and most negotiating room is concentrated at the top of the market… precisely where inventory is piling up fastest relative to demand.